
I’ve been looking into how to be more pro-active about monitoring my HomeLab lately. With that in mind, I went on a bit of a monitoring dive and setup some basic tools on my raspberry pi’s. I wanted to keep track of what I did, so why not write it up in a blog post.
More specifically, this post will give you a quick overview of how I got up and running with InfluxDB and Telegraf for monitoring my servers.
Why InfluxDB and Telegraf?
I’ve already used Grafana (a dashboarding tool) at work and like how it works; I also know that Grafana is commonly used for system monitoring so I started my search there. After some Googling, I kept seeing a few other tools used alongside Grafana:
- InfluxDB: a database for efficiently storing and accessing time series data (perfect for sensors, system data, etc.). Grafana has a first party integration with InfluxDB as well.
- Telegraf: a server agent that allows you to collect sensor info from your servers and send it back to InfluxDB and other time-series databases like Prometheus.
Sweet! I have a few tools to start experimenting with.
Installing InfluxDB
The logical first step was to install InfluxDB somewhere so my servers could write back to it. InfluxDB has a docker image that you can use and since I have an Unraid server that’s already running around 20 docker images, I threw it on there.
I was pleasantly surprised by how easy setting up InfluxDB was!
- Followed the setup guide in the web interface and setup an admin user (should be at http://your-servers-ip:8016/).
- Created a buckets for each pi to write to (basically a database).
- Created a telegraf config for each pi and note the API key, and configuration files (telegraf.conf) InfluxDB provided.
From there, InfluxDB seemed to suggest I could setup Telegraf on my pis.
Installing Telegraf
Now that I had some configurations, I went and did some reading on how to configure telegraf on the docs site. I logged in to both my pi’s, and used the commands below:
# install telegraf
sudo apt install telegraf -y

# paste in the INFLUXDB_KEY provided by InfluxDB
# at the bottom of the file.
# this will automatically define the variable for
# the user you're logged in as on login.
vim ~/.bashrc

# paste in the telegraf.conf file provided by InfluxDB
vim /etc/telegraf/telegraf.conf

# start the telegraf service, and enable it
sudo systemctl start telegraf
sudo systemctl enable telegraf

# make sure that the telegraf service has connected to
# InfluxDB successfully.
sudo systemctl status telegraf

# the output of the above command should
# NOT include any 401 errors. if it does,
# you may need to paste the API key into
# your telegraf.conf file manually
Once I got that done I knew that telegraf should be writing back to my InfluxDB database every 10 seconds.
Seeing server data in InfluxDB
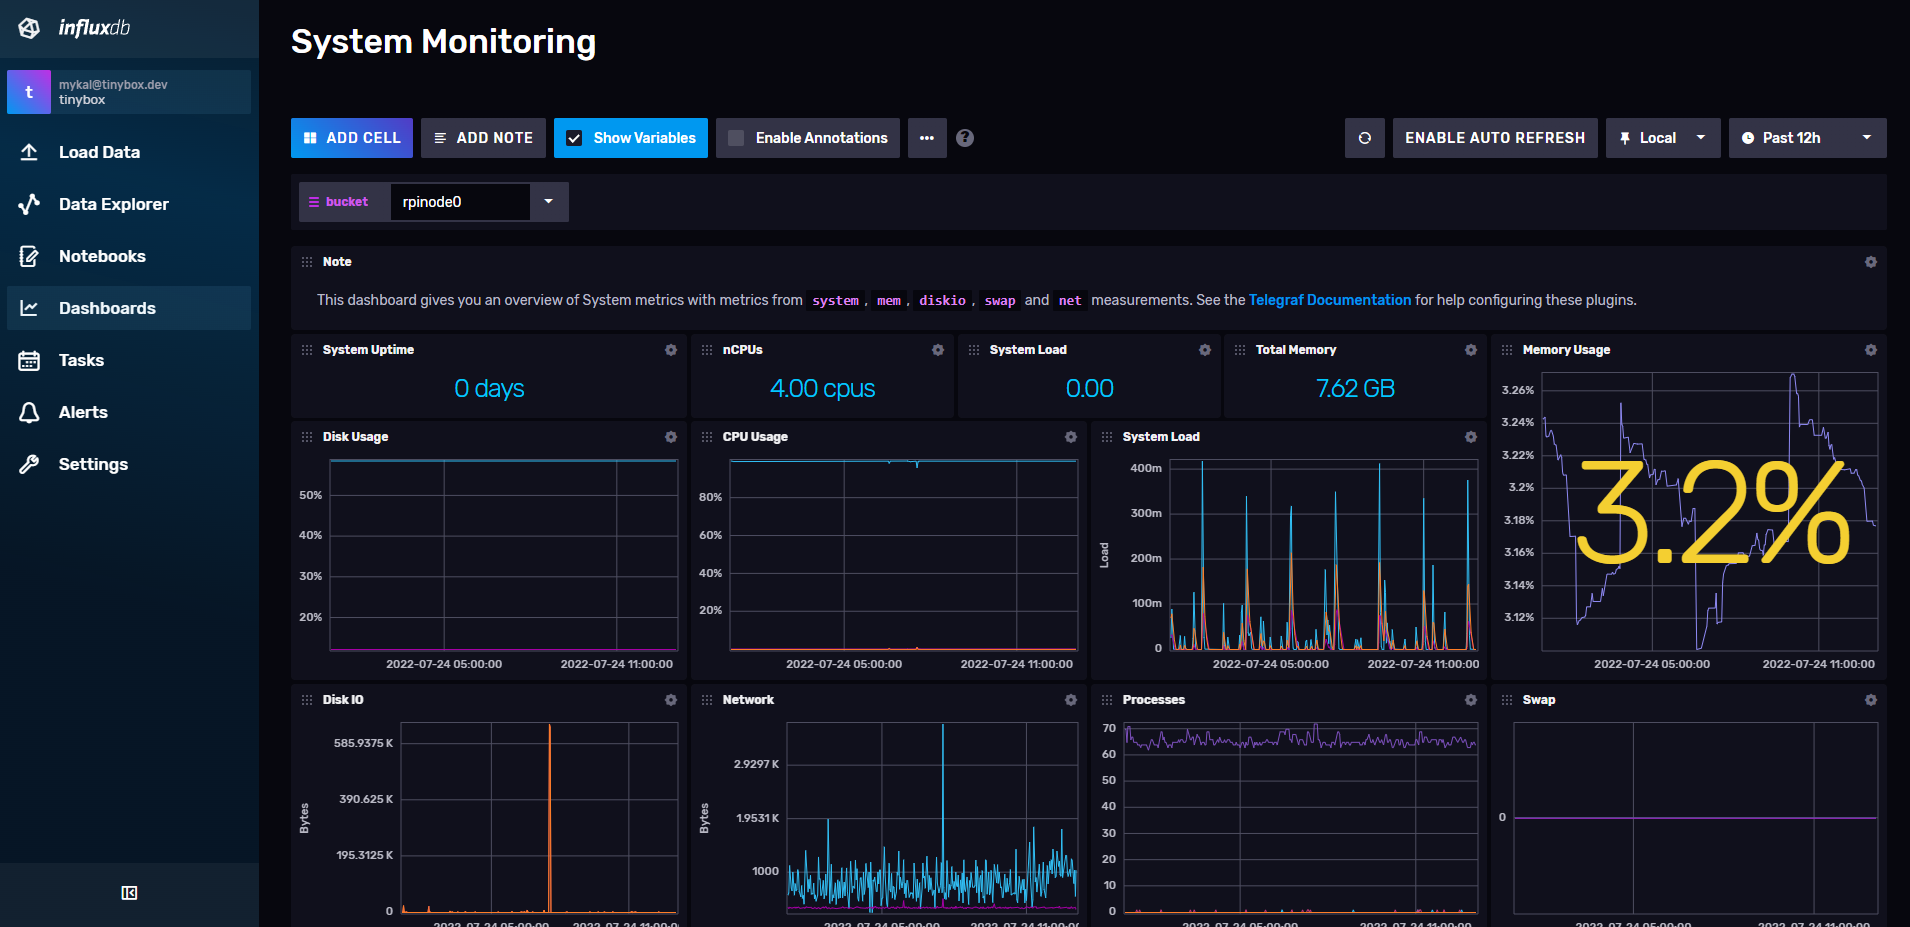
To confirm that InfluxDB was actually getting that data, I logged back into the InfluxDB web app and clicked the “dashboards” link on the sidebar. Thankfully, InfluxDB comes with a default “Systems” dashboard that you can use for reviewing your data, I hopped in there and saw that data was getting into InfluxDB, sweet 🎉
Next steps
There’s a whole lot more I can do to expand the monitoring capabilities, here are some ideas:
- 📊 Grafana dashboards: I brought Grafana up at the beginning of the post, but I haven’t actually implemented it yet. Their dashboards are awesome and it would be a good next step.
- ⏰ Usage alerting: InfluxDB (and Grafana actually) lets you create alerts on specific criteria. For example, if your server goes over 80% usage, or goes down, you can get a slack message.
- 📚 Keep learning: There’s a whole job around monitoring and reliability of services, so logically there’s a whole lot you can learn in the field.
Thanks for reading!